On Backtest Overfitting
A backtest that looks good is not evidence of edge. It may be evidence of overfitting.
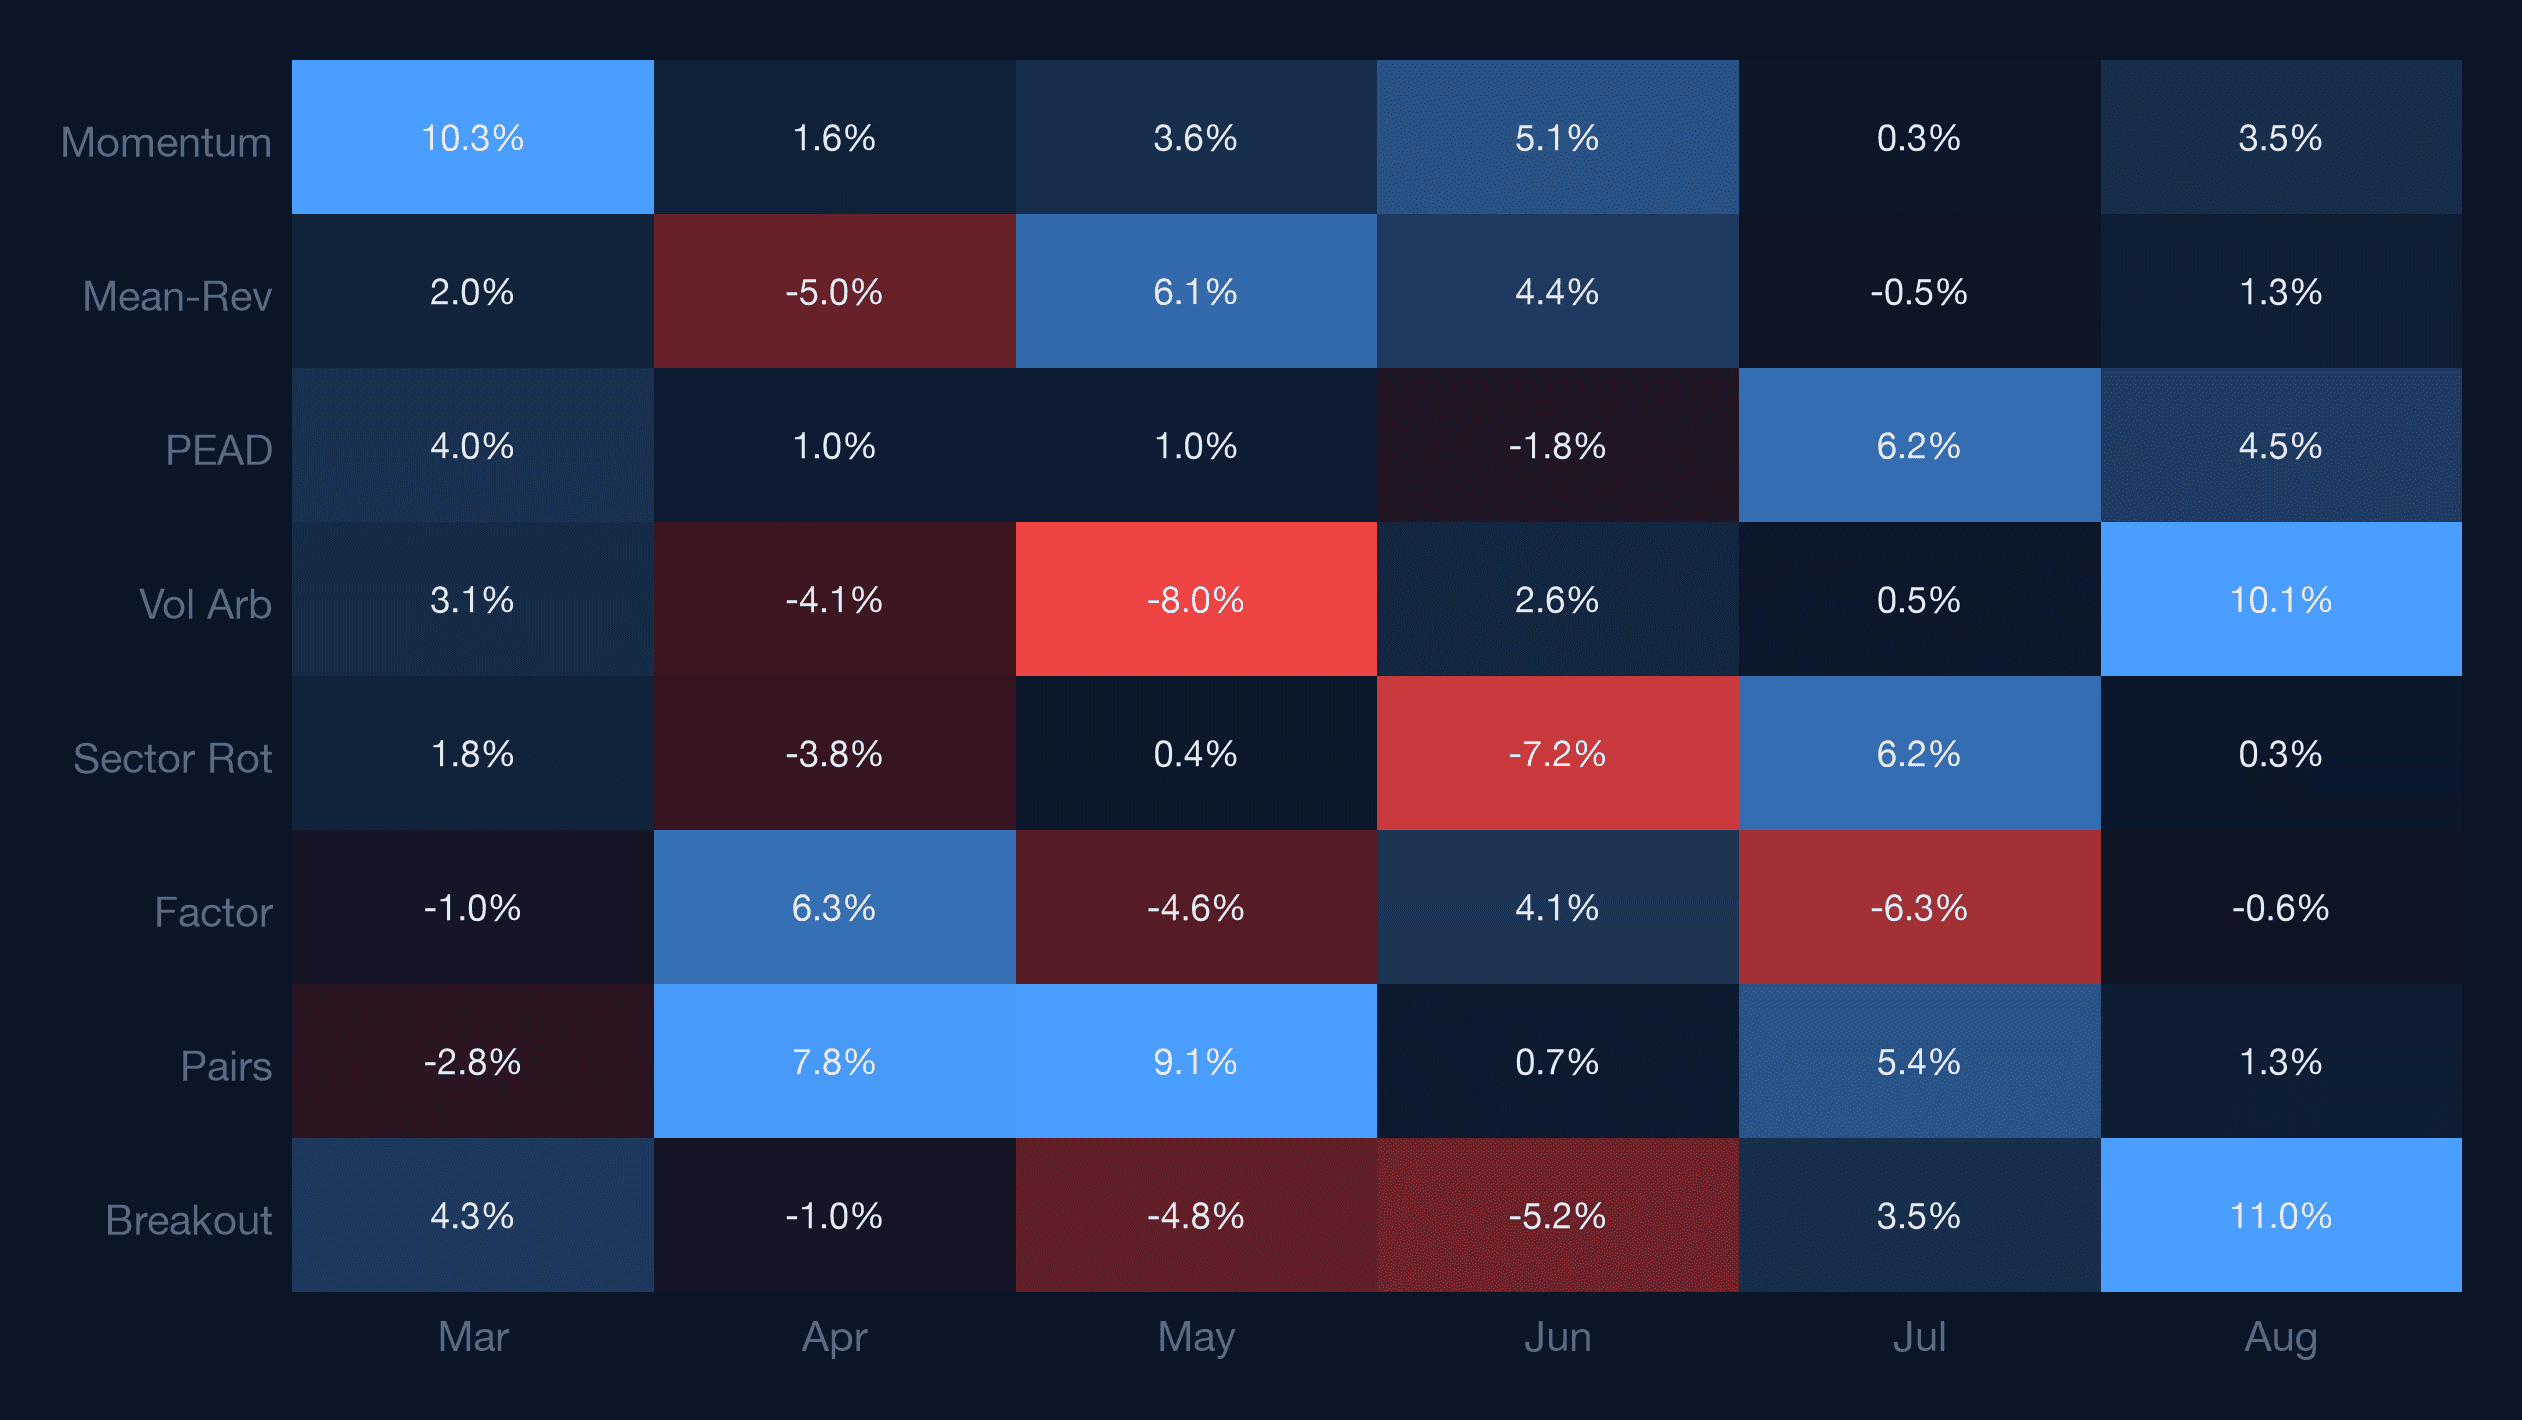
The central problem in quantitative strategy research is distinguishing real signals from noise. Given enough parameters and enough historical data, almost any strategy can be made to look profitable in hindsight. The question is whether that profitability reflects a persistent market pattern or a statistical artifact.
We address this in three ways.
First, we compute deflated Sharpe ratios using the framework from Bailey and Lopez de Prado (2014), which adjusts for the number of strategies tested, return distribution skewness, and kurtosis. A raw Sharpe of 2.0 from 50 independent trials may deflate to 0.8 after correction. The deflated number is the one that matters.
Second, we estimate the Probability of Backtest Overfitting using combinatorial symmetric cross-validation (Bailey et al., 2017). This evaluates whether the in-sample best strategy consistently underperforms out-of-sample across all possible data splits. A PBO above 0.5 means the strategy is more likely overfit than genuine.
Third, we maintain a trial registry that logs every strategy and parameter combination ever tested. This registry feeds directly into the deflation calculations and prevents survivorship bias in our research records. The failures matter as much as the successes.
The Deflated Sharpe Ratio
The standard Sharpe ratio overstates expected performance when multiple strategies are tested. The deflated Sharpe ratio corrects for the number of independent trials, skewness, and kurtosis of the return distribution. Under the null hypothesis of zero expected Sharpe, the probability that the best of N trials exceeds the observed value is computed from the distribution of the maximum order statistic. A seemingly strong result from many trials often deflates significantly after correction.
Our Trial Registry
We maintain a complete registry of every strategy variant tested. This prevents selective reporting and feeds directly into the deflation correction. Current aggregate statistics:
Metrics reflect cumulative research activity. Past performance, whether actual or simulated, is not indicative of future results. See full disclosures.
References
- Bailey, D. H. and Lopez de Prado, M. (2014). "The Deflated Sharpe Ratio: Correcting for Selection Bias, Backtest Overfitting, and Non-Normality." Journal of Portfolio Management.
- Bailey, D. H., Borwein, J. M., Lopez de Prado, M., and Zhu, Q. J. (2017). "The Probability of Backtest Overfitting." Journal of Computational Finance.